MATLAB Plotting-taken to a next level
Hey guys!! Welcome back! :)
Now that you have got the basic idea to plot a set of points
or functions in MATLAB, let us move further and deal with some of important
properties which can be implemented in plotting.
The following topics are to be covered in this post:-
1. Adding tiles, axis labels and annotations.
2. Multiple data sets in one plot.
So, let’s get started!!
Titles; axis
labels; annotations:-
To add title to your plot, simply do this :- (See the
previous post’s example of the plot: Basic MATLAB Plotting)
>>title(‘plot of the sine function’)
To label your plot's, x-axis and y-axis, type this:-
>>xlabel(‘x= 0 to \pi’)
>>ylabel(‘sine of x’)
 |
| MATLAB Plot with labels & possible errors while using them |
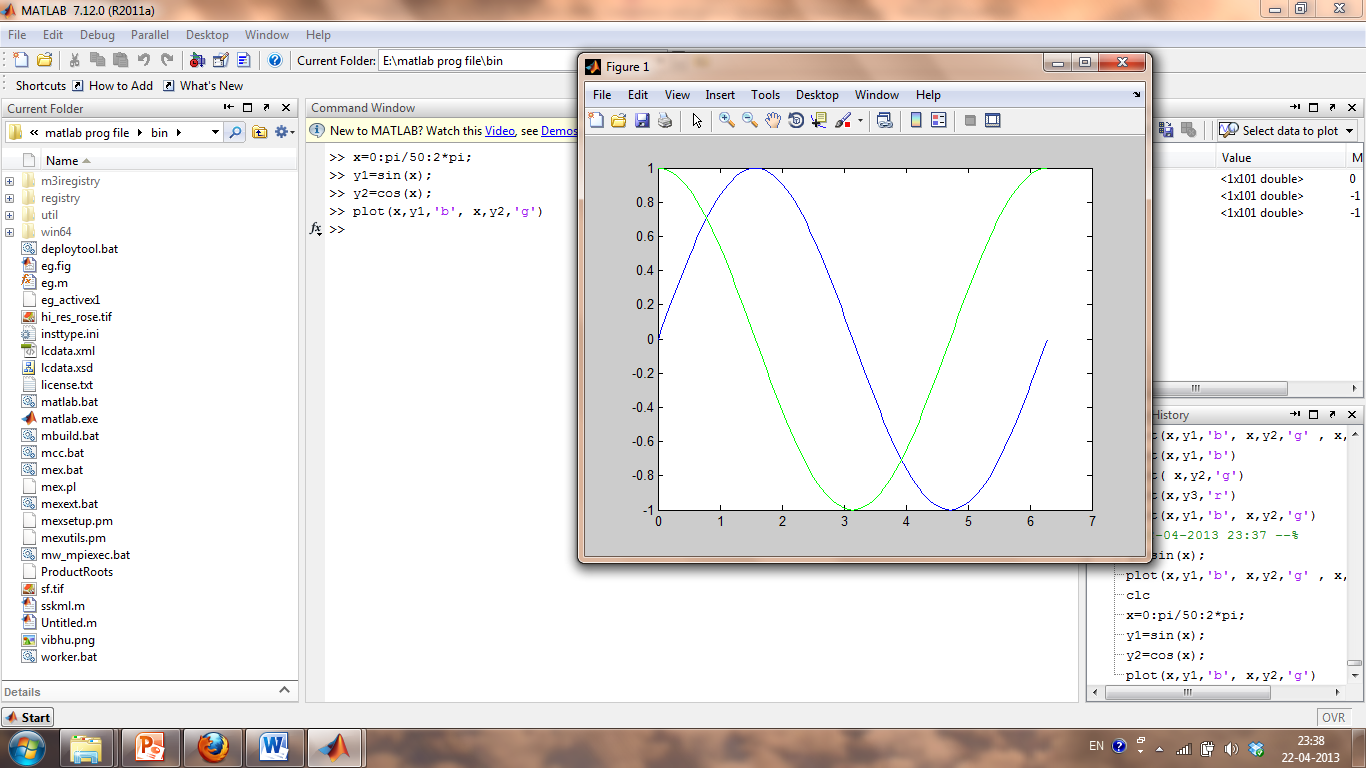
Next, we will see how to trace various curves on a single
plot!
To plot y1=sin(x); y2=cos(x);
So let’s type:-
>>x=0:pi/50:2*pi;
>>y1=sin(x);
>>y2=cos(x);
>>plot(x,y1, 'b', x,y2, 'g' )
Here in the plot function the 'b' will turn the plot line to blue & 'r' to red for the second funtion.
Through this the three curves get plotted and the colours of
the curves will be predefined by MATLAB.
 |
| MATLAB's Multi Function Plotting in a Single Plot/Graph Window |
An Article By
Pulkit Khandelwal,
Student @ VIT University.
