MATLAB : Fast Fourier Transform (FFT) & Inverse Fast Fourier Transform (IFFT) , Without Using built in MATLAB function

MATLAB based Fast Fourier Transform (FFT) & Inverse Fast Fourier Transform (IFFT).
The following MATLAB implemented method of finding the FFT is based on the formula given below:

X(k)= Σ x(n)e^(-j*2*pi*k*n/N)
Σ is from k=0 to N-1

 X_k =  \sum_{n=0}^{N-1} x_n e^{-{i 2\pi k \frac{n}{N}}}\qquadk = 0,\dots,N-1. MATLAB based Fast Fourier Transform (FFT) & Inverse Fast Fourier Transform (IFFT) Calculation, Without Using fft & ifft inbuilt MATLAB function

Similarly we have used the formula for IFFT as: 

x(n)= (1/N)[Σ X(K)e^(j*2*pi*k*n/N)]
Σ is from n=0 to N-1

If you want to make your work for calculating the FFT & IFFT function even more simpler, then you can feed in your sequence directly to fft() function of MATLAB.


MATLAB Code for calculating FFT (Fast Fourier Transform) & IFFT (Inverse Fast Fourier Transform):

clc;
close all;
clear all;
x = input('Enter the sequence for FFT = ');
N = length(x);
%finding the length of entered sequence for N point FFT

for k = 1:N %for every value of k
y(k) = 0;
for n = 1:N
%for every value of n
y(k) = y(k)+x(n)*exp(-1i*2*pi*(k-1)*(n-1)/N);
%as per FFT formula 0 to n-1
end
end

t = 0:N-1;
subplot(3,1,1);
stem(t,x);
% for discrete plotting
%plotting input sequence
ylabel('Amplitude');
xlabel('n');
title('Input');

magnitude = abs(y);
% absolute values of individual FFT complex
disp('FFT : ');
disp(magnitude);

t = 0:N-1;
subplot(3,1,2);
stem(t,magnitude);

%plotting FFT sequence
ylabel('Amplitude');
xlabel('K');
title('FFT');

R = length(y);
%length of the fft array

for n = 1:R
x1(n) = 0;
for k = 1:R
%loop as per the IFFT formula
    x1(n) = x1(n)+(1/R)*y(k)*exp(1i*2*pi*(k-1)*(n-1)/R);
end
end


t = 0:R-1;
subplot(3,1,3);
stem(t,x1);

%ploting IFFT sequence
disp('IFFT :');
disp(x1);
ylabel('Amplitude');
xlabel('n');
title('IFFT');


Sample Input & Output:

Enter the sequence for FFT = [1 2 3 4 5]

FFT Sequence =
   15.0000    4.2533    2.6287    2.6287    4.2533

IFFT Sequence =
 
   1.0000 - 0.0000i    2.0000 - 0.0000i    3.0000    4.0000   5.0000 + 0.0000i


Output Graph:

MATLAB based Fast Fourier Transform (FFT) & Inverse Fast Fourier Transform (IFFT) Calculation, Without Using fft & ifft inbuilt MATLAB function

Read More At Digital iVision Labs:

#FSK Simulation Code Using MATLAB
#Phase Shift Keying (PSK) Modulation MATLAB Simulation, With MATLAB Code
#Amplitude Shift Keying (ASK) Modulation MATLAB Simulation, With MATLAB Code

#Matlab Christmas Tree Plot- Christmas celebration through matlab way - Merry Christmas!

1 comments:

Right Shifting the Histogram (Histogram Shifting) or Making the Image Brighter Using MATLAB

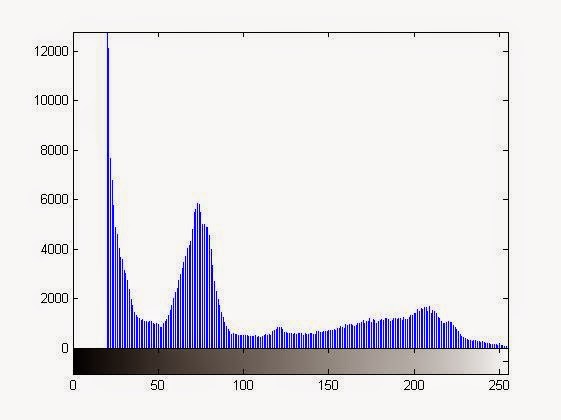
Yes making your histogram to shift right  & making your image more bright are one & the same thing. Very easy to perform & you just need to apply some very basic arithmetic operation on the image. The operations could be either addition or multiplication with a constant greater than 1.

For this article, we have taken a 640x640 grayscale image which is kept in the Current Working Directory. After opening it in MATLAB we will perform the further operations.

Histogram Left Shifting by subtraction of a constant: 
MATLAB Code & Explanation:
%Suppose we are adding a constant value of 20 from each element of the grayscale image
%In the results it will be clearly visible that the image has become more bright & the
%histogram is shifted to right side, & no values in the histogram for the value range 0-20
% i.e., at first 20 values in the histogram is vanished.

x=imread('new.jpg'); 
% if the image is not in the current working directory you need to specify the full path.

imshow(x);
%for showing the original image

figure,imhist(x)
%for showing the histogram of original image

n=x+20;
%performing the arithmetic operation on each element of the image  & storing the result in new variable

figure,imhist(n)
%for showing the operated image

figure,imshow(n)
%for showing the histogram of operated image


Results of The above MATLAB code of Left Shifting the Histogram using subraction

Original Unprocessed Image- Right Shifting the Histogram (Histogram Shifting) or Making the Image Brighter Using MATLAB
Original Unprocessed Image
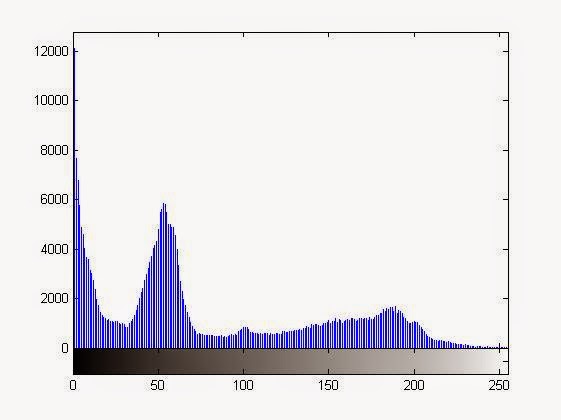
Histogram of Original Image -Right Shifting the Histogram (Histogram Shifting) or Making the Image Brighter Using MATLAB
Histogram of Original Image
More brighter image
Image After the arithmetic Operation (More Darker Than Original)
Right Shifting the histogram
The right shifted histogram of the image after operation

Histogram Left Shifting By multiplication of a constant greater than 1 (>1): 
MATLAB Code & Explanation:


x=imread('new.jpg'); 
% if the image is not in the current working directory you need to specify the full path.

imshow(x);
%for showing the original image

figure,imhist(x)
%for showing the histogram of original image

n=x*1.25;
%performing the arithmetic operation on each element of the image  & storing the result in new variable

figure,imhist(n)
%for showing the operated image

figure,imshow(n)
%for showing the histogram of operated image


Results of The above MATLAB code of Left Shifting the Histogram using multiplication

Original Unprocessed Image- Right Shifting the Histogram (Histogram Shifting) or Making the Image Brighter Using MATLAB
Original Unprocessed Image
Histogram of Original Image - Right Shifting the Histogram (Histogram Shifting) or Making the Image Brighter Using MATLAB
Histogram of Original Image
Image After the arithmetic Operation (More Brighter Than Original)
Image After the Multiplication with a constant greater than 1

Right Shifted Histogram after the multiplication operation on the image
Histogram of Original Image
In this case the histogram is not seeming to be shifted but it is, as 0x(anything)=0 only the values with pixel value '0' is not changed.

In both the cases, the right shifted histogram is roughly the shape of the original one.

NOTE:  If the constant which is being added or multiplied is very large you are going to obtain a nearly saturated image or a histogram very much shifted to the right

0 comments:

Left Shifting the Histogram (Histogram Shifting) or Making the Image Darker / Less Bright using MATLAB

Yes making your histogram to shift left & making the image more dark or reducing the brightness are one & the same thing. Very easy to perform & you just need to apply some very basic arithmetic operation on the image. The operations could be either subtraction or multiplication with a constant less than 1.

For this article, we have taken a 640x640 grayscale image which is kept in the Current Working Directory. After opening it in MATLAB we will perform the further operations.

Histogram Left Shifting by subtraction of a constant: 
MATLAB Code & Explanation:
%Suppose we are subtracting a constant value of 20 from each element of the grayscale image
%In the results it will be clearly visible that the image has become darker or less bright & the
%histogram is shifted to left side, & there are no values in the histogram for the value range 235-255
% i.e., at last 20 values in the histogram is vanished.

x=imread('new.jpg'); 
% if the image is not in the current working directory you need to specify the full path.

imshow(x);
%for showing the original image

figure,imhist(x)
%for showing the histogram of original image

n=x-20;
%performing the arithmetic operation on each element of the image  & storing the result in new variable

figure,imhist(n)
%for showing the operated image

figure,imshow(n)
%for showing the histogram of operated image


Results of The above MATLAB code of Left Shifting the Histogram using subraction

Original Unprocessed Image- Left Shifting the Histogram or Making the Image Darker / Less Bright using MATLAB
Original Unprocessed Image
Histogram of Original Image - Left Shifting the Histogram or Making the Image Darker / Less Bright using MATLAB
Histogram of Original Image
Image After the arithmetic Operation (More Darker Than Original)
Left Shifted Histogram after the subtraction operation on the image

Histogram Left Shifting By multiplication of a constant less than 1 (<1): 
MATLAB Code & Explanation:


x=imread('new.jpg'); 
% if the image is not in the current working directory you need to specify the full path.

imshow(x);
%for showing the original image

figure,imhist(x)
%for showing the histogram of original image

n=x*0.85;
%performing the arithmetic operation on each element of the image  & storing the result in new variable

figure,imhist(n)
%for showing the operated image

figure,imshow(n)
%for showing the histogram of operated image


Results of The above MATLAB code of Left Shifting the Histogram using multiplication

Original Unprocessed Image- Left Shifting the Histogram or Making the Image Darker / Less Bright using MATLAB
Original Unprocessed Image
Histogram of Original Image - Left Shifting the Histogram or Making the Image Darker / Less Bright using MATLAB
Histogram of Original Image
Image After the arithmetic Operation (More Darker Than Original)
Left Shifted Histogram after the multiplication operation on the image
Histogram of Processed Image
In both the cases, the left shifted histogram is roughly the shape of the original one.

1 comments: