Linear Convolution of two Discrete Sequences usng function Using MATLAB Code: With MATLAB code
In mathematics & signal processing, convolution is a mathematical method applied on two functions f and g, producing a third function that is typically viewed as a modified version of one of the original functions.
- Flip (reverse) one of the digital functions.
- Shift it along the time axis by one
sample, j.
- Multiply the corresponding values of
the two digital functions.
- Summationof products from step 3 to
get one point of the digital convolution
at j.
- Repeat steps 1-4 to obtain the digital convolution at all times, j where the digital functions overlap.
More References about Convulation:
MATLAB Code to Perform Convolution of two Discrete Sequences using MATLAB conv() Function:
%Code Starts Here
clc;
clear all;
close all;
x1 = input('Enter First sequence x1(n)[] : ');
t1 = input('Enter Origin location Of Sequence x1 : ');
x2 = input('Enter Second sequence x2(n)[] : ');
t2 = input('Enter Origin location Of Sequence x2 : ');
l1 = length(x1); %length of sequence x1
l2 = length(x2); %length of sequence x2
ln = l1+l2-1; %length of convoluted sequence
y = conv(x1,x2); % performing convolution using conv() function
a = t1+l1-1;
t = t1:a;
subplot(3,1,1);
stem(t,x1);
xlabel('Time');
ylabel('Amplitude');
title('x1');
a = t2+l2-1;
t = t2:a;
subplot(3,1,2);
stem(t,x2);
xlabel('Time');
ylabel('Amplitude');
title('x2');
tn = t1+t2;
a = tn+ln-1;
t = tn:a;
subplot(3,1,3);
disp('Convoluted Sequence ');
disp(y); % For printing the convulated output in MATLAB command window
stem(t,y); % For plotting the convulated output in MATLAB graph window
xlabel('Time');
ylabel('Amplitude');
title('Convoluted Sequence');
Sample Input (As it will be seen in the Command Window) :
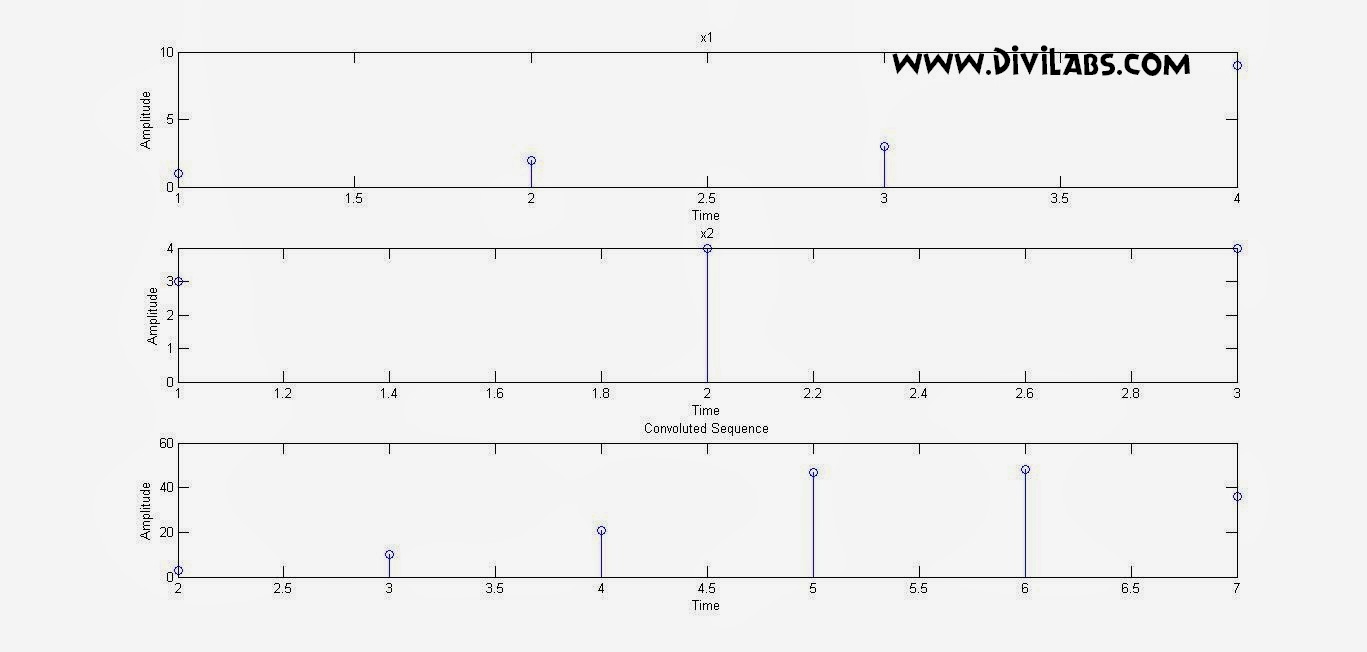
Enter First sequence x1(n)[] : [1 2 3 9]
Enter Origin location Of Sequence x1 : 1
Enter Second sequence x2(n)[] : [3 4 4]
Enter Origin location Of Sequence x2 : 1
Convoluted Sequence
3 10 21 47 48 36
Enter Origin location Of Sequence x1 : 1
Enter Second sequence x2(n)[] : [3 4 4]
Enter Origin location Of Sequence x2 : 1
Convoluted Sequence
3 10 21 47 48 36
Graph Thus Obtained: (Containing the 2 input sequences along with the resulted convoluted sequences)

Visit More On Digital iVision Labs:
#FSK Simulation Code Using MATLAB
#Phase Shift Keying (PSK) Modulation MATLAB Simulation, With MATLAB Code
#Amplitude Shift Keying (ASK) Modulation MATLAB Simulation, With MATLAB Code
#Matlab Christmas Tree Plot- Christmas celebration through matlab way - Merry Christmas!

0 comments: