Padding Borders of an Image with Zeros or Any Constant Value, Using MATLAB
Why Padding of borders is required While working with an Image?

Now after an execution of the code:
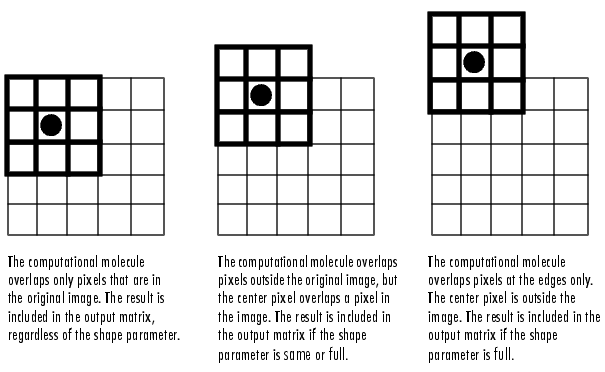
When you apply a filter to pixels on the borders of an image, some of
the elements of the masking block or filter kernel may not overlap actual image
pixels. For example, if the kernel is 3-by-3 and you are computing the
result for a pixel on the top row of the image, some of the elements of
the kernel are outside the border of the image. For example see the below image,

(Image illustration Courtesy, CUVT Prague)
This technique is also used by the software like MS Word, PhotoShop when we want to add a border in the image.
Padding zeros in the border of an Image: MATLAB Implementation
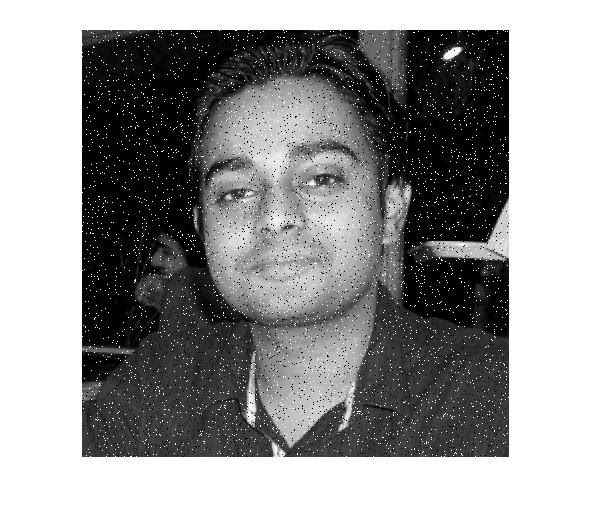
Suppose you are having any image;
MATLAB Code for padding Zeros on the boundary of an image:
clc
clear all
close all
i=imread('xyz.jpg'); %read the desired image
%i=rgb2gray(i); %Uncomment this to Convert the image to grayscale if original one is RGB
imshow(i) %Show the original image before preprocessing
p=input('Input no. of rows/columns to pad:');
Padding zeros in the border of an Image: MATLAB Implementation
Suppose you are having any image;
 |
| Original Grayscale image ready to be padded with zero or any other constant value |
clc
clear all
close all
i=imread('xyz.jpg'); %read the desired image
%i=rgb2gray(i); %Uncomment this to Convert the image to grayscale if original one is RGB
imshow(i) %Show the original image before preprocessing
p=input('Input no. of rows/columns to pad:');
%Ask the user to get the number of rows/columns to be padded
pad=uint8(zeros(size(i)+2*p));
pad=uint8(zeros(size(i)+2*p));
%generate an initial zero matrix with the dimension added with 2*p more.
for x=1:size(i,1)
for y=1:size(i,2)
pad(x+p,y+p)=i(x,y);
for x=1:size(i,1)
for y=1:size(i,2)
pad(x+p,y+p)=i(x,y);
%accessing the x+p & y+p location and storing x,y location pixel into that
end
end
figure,imshow(pad) %Show the padded zero image
end
figure,imshow(pad) %Show the padded zero image
Result of above code to pad zero in an image:
Input no. of rows/columns to pad:6
 |
| Zeros padded grayscale image, Using MATLAB |
Original Dimension if the image: 640x640
Resultant Dimension if the image: 652x652
A part of the resultant Image with a corner looks like:
0 0 0 0 0 0 0 0 0 0 0
0 0 0 0 0 0 0 0 0 0 0
0 0 0 0 0 0 0 0 0 0 0
0 0 0 0 0 0 0 0 0 0 0
0 0 0 0 0 0 0 0 0 0 0
0 0 0 0 0 0 0 0 0 0 0
0 0 0 0 0 0 217 217 217 217 217
0 0 0 0 0 0 217 217 217 216 216
0 0 0 0 0 0 217 217 217 216 216
0 0 0 0 0 0 218 218 217 217 216
0 0 0 0 0 0 219 218 218 217 216
0 0 0 0 0 0 217 217 217 216 216
0 0 0 0 0 0 214 214 214 214 214
0 0 0 0 0 0 212 212 212 212 212
0 0 0 0 0 0 0 0 0 0 0
0 0 0 0 0 0 0 0 0 0 0
0 0 0 0 0 0 0 0 0 0 0
0 0 0 0 0 0 0 0 0 0 0
0 0 0 0 0 0 0 0 0 0 0
0 0 0 0 0 0 217 217 217 217 217
0 0 0 0 0 0 217 217 217 216 216
0 0 0 0 0 0 217 217 217 216 216
0 0 0 0 0 0 218 218 217 217 216
0 0 0 0 0 0 219 218 218 217 216
0 0 0 0 0 0 217 217 217 216 216
0 0 0 0 0 0 214 214 214 214 214
0 0 0 0 0 0 212 212 212 212 212
MATLAB Code for padding Any Constant Number on the boundary of an image:
%With a little modification of the above code we can achieve that
%The new code will be like
clc
clear all
close all
i=imread('xyz.jpg'); %read the desired image
%i=rgb2gray(i); %Uncomment this to Convert the image to grayscale if original one is RGB
imshow(i) %Show the original image before preprocessing
p=input('Input no. of rows/columns to pad:');
clear all
close all
i=imread('xyz.jpg'); %read the desired image
%i=rgb2gray(i); %Uncomment this to Convert the image to grayscale if original one is RGB
imshow(i) %Show the original image before preprocessing
p=input('Input no. of rows/columns to pad:');
%Ask the user to get the number of rows/columns to be padded
v=input('The value of the constant to be padded:');
pad=uint8(ones(size(i)+2*p)*v);
pad=uint8(ones(size(i)+2*p)*v);
%generate an initial zero matrix with the dimension added with 2*p more.
for x=1:size(i,1)
for y=1:size(i,2)
pad(x+p,y+p)=i(x,y);
for x=1:size(i,1)
for y=1:size(i,2)
pad(x+p,y+p)=i(x,y);
%accessing the x+p & y+p location and storing x,y location pixel into that
end
end
figure,imshow(pad) %Show the constant padded image
end
figure,imshow(pad) %Show the constant padded image
Now after an execution of the code:
Input no. of rows/columns to pad:4
Value of the costant? 4
Value of the costant? 4
Our Padded Image matrix will look like:
4 4 4 4 4 4 4 4 4
4 4 4 4 4 4 4 4 4
4 4 4 4 4 4 4 4 4
4 4 4 4 4 4 4 4 4
4 4 4 4 217 217 217 217 217
4 4 4 4 217 217 217 216 216
4 4 4 4 217 217 217 216 216
4 4 4 4 218 218 217 217 216
4 4 4 4 219 218 218 217 216
4 4 4 4 4 4 4 4 4
4 4 4 4 4 4 4 4 4
4 4 4 4 4 4 4 4 4
4 4 4 4 217 217 217 217 217
4 4 4 4 217 217 217 216 216
4 4 4 4 217 217 217 216 216
4 4 4 4 218 218 217 217 216
4 4 4 4 219 218 218 217 216


0 comments: