Binary Phase Shift Keying (BPSK) Modulation MATLAB Simulation, With MATLAB Code
So what is PSK (Phase Shift Keying)?
Phase-shift keying (PSK) is a digital modulation technique that projects data by modulating, the phase of a reference signal (the carrier wave).
Any digital modulation scheme uses a finite number of distinct signals to represent digital data. PSK uses a finite number of phases, each assigned a unique pattern of binary digits. Usually, each phase encodes an equal number of bits. Each pattern of bits forms the symbol that is represented by the particular phase. The demodulator,
which is designed specifically for the symbol-set used by the
modulator, determines the phase of the received signal and maps it back
to the symbol it represents, thus recovering the original data.
In the example MATLAB Simulation of Phase Shift Keying (PSK), the
user is asked about the frequency of the carrier wave, Message
periodic pulse & the Amplitude of the waves (considering both square
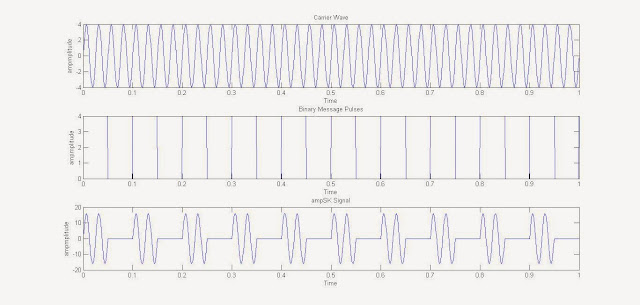
message wave & carrier wave have equal amplitude). The phase of the carrier wave will change by 180 degree whenever a zero is changed to 1 or vice-verso. The phase will not change if in 2 successive time period there is no change in message bit value.
The MATLAB code lets the user to plot 3 graphs, namely of The Carrier
Wave (Sinusoid), The Binary Message Pulse & The Phase Shift
Keyed Wave.
MATLAB Code FOR PSK (Phase Shift Keying) :
clc %for clearing the command window
close all %for closing all the window except command window
clear all %for deleting all the variables from the memory
t=0:.001:1; % For setting the sampling interval
fc=input('Enter frequency of Carrier Sine wave: ');
fm=input('Enter Message frequency : ');
amp=input('Enter Carrier & Message Amplitude(Assuming Both Equal):');
c=amp.*sin(2*pi*fc*t);% Generating Carrier Sine
subplot(3,1,1) %For Plotting The Carrier wave
plot(t,c)
xlabel('Time')
ylabel('Amplitude')
title('Carrier')
m=square(2*pi*fm*t);% For Plotting Message signal
subplot(3,1,2)
plot(t,m)
xlabel('time')
ylabel('ampmplitude')
title('Message Signal')% Sine wave multiplied with square wave in order to generate PSK
x=c.*m;
subplot(3,1,3) % For Plotting PSK (Phase Shift Keyed) signal
plot(t,x)
title('Carrier')
m=square(2*pi*fm*t);% For Plotting Message signal
subplot(3,1,2)
plot(t,m)
xlabel('time')
ylabel('ampmplitude')
title('Message Signal')% Sine wave multiplied with square wave in order to generate PSK
x=c.*m;
subplot(3,1,3) % For Plotting PSK (Phase Shift Keyed) signal
plot(t,x)
xlabel('t')
ylabel('y')
title('PSK')
ylabel('y')
title('PSK')
NOTE: Use Semicolon ';' in order to suppress the output from
coming to the MATLAB's Command Window, whenever declaring a periodic
pulse, as it can display a vary large matrix in the output, so you can
miss what you want.
Enter frequency of Carrier Sine wave: 60
Enter Message frequency : 10
Enter The Carrier & Message Amplitude(Assuming Both Equal): 3
Enter frequency of Carrier Sine wave: 60
Enter Message frequency : 10
Enter The Carrier & Message Amplitude(Assuming Both Equal): 3
RESULT:
 |
| Resultant Graph Of PSK Modulation (Phase Shift Keying) In MATLAB |


5 comments: