MATLAB BATMAN Equation Plot

The BATMAN plot has been in news since google has plotted it on its website.

Google BATMAN Plot
Google BATMAN Plot

The plot, itself when taken as a whole, is not a function, as its clear from the above google plot, that it has 2 values of Y-Axis for a single value of X-Axis, & vice versa. Also its clear from the above plot that its a piecewise function, we have plotter the BATMAN head, wings (Upper & Lower part), lover body, etc separately. Thus mathematically it is feasible only when it has to be plotted piece wise.

So, if someone want to plot it, in MATLAB. He has to do like the same thing as done above. And how the MATLAB Batman equations Plot looks like, is given below:
hold on

% Outer wings
f1 = '(x/7)^2 * sqrt(abs(abs(x)-3)/(abs(x)-3)) + (y/3)^2 * sqrt(abs(y + 3/7*sqrt(33))/(y + 3/7*sqrt(33))) - 1';
ezplot(f1,[-8 8 -3*sqrt(33)/7 6-4*sqrt(33)/7]);


% Bottom
f2 = 'abs(x/2)-(3*sqrt(33)-7) * x^2/112 - 3 + sqrt(1-(abs(abs(x)-2)-1)^2) - y';
ezplot(f2,[-4 4]);


% Outer ears
f3 = '9 * sqrt(abs((1-abs(x))*(abs(x)-0.75)) / ((1-abs(x))*(abs(x)-0.75))) - 8*abs(x) - y';
ezplot(f3,[-1    -0.75 -5 5]);
ezplot(f3,[ 0.75  1    -5 5]);


% Inner ears
f4 = '3*abs(x) + 0.75*sqrt(abs((0.75-abs(x))*(abs(x)-.5)) / ((.75-abs(x))*(abs(x)-.5))) - y';
ezplot(f4,[-0.75 0.75 2.25 5]);


% Connect inner ears (flat line)
f5 = '2.25*sqrt(abs(((0.5-x)*(0.5+x))/((0.5-x)*(0.5+x)))) - y';
ezplot(f5,[-0.5 0.5 -5 5]);


% Inner wings
f6 = '6*sqrt(10)/7 + (1.5-0.5*abs(x)) * sqrt(abs(abs(x)-1) / (abs(x)-1)) - 6*sqrt(10)/14 * sqrt(4-(abs(x)-1)^2) - y';
ezplot(f6,[-3 -1 -5 5]);
ezplot(f6,[ 1  3 -5 5]);


% Change line color and width
set(get(gca,'children'),'Color','b','Linew',2)

% Title
title('Batman'); 

 So here is the curious result that you will get after running the above code:
 
MATLAB BATMAN Equation Plot
So just have a try with the code, & if you get something interesting out of it. Just comment back with the code or mail me, I will love to add that also as an extension of this article.


0 comments:

Plotting Reddit dot com Mascot (The Reddit Alien) in MATLAB

 The idea of plotting Reddit Mascot (The Reddit Alien), had stricken many people before, who were there in reddit & were a member of subreddit, /r/matlab. But it was Nov. 20, 2013 a reddit user, with the profile link http://www.reddit.com/user/Pilotics has posted this image. And this was the MATLAB plot of reddit mascot, the Reddit Alien.
MATLAB Plot of reddit Alien (Reddit MASCOT)
Many have requested him the code of the above plot, but no reply came. But on April 20, 2014, he replied with the code. And the code is:

hold on
view([20 10])

% Head
X=linspace(-2,2*pi,50); Y=linspace(0,2*pi,50);
[Y X]=meshgrid(Y,X);
x=-5.*cos(X).*-2.*sin(Y);
y=-2.*sin(Y).*-2.*sin(X);
z=-sqrt(40).*cos(Y);
surf(x,y,z)


% Antenna
clc % Stalk
R = .25;
Rs = linspace(0, R, 4);
SideH = 5;
Sides = 0:SideH;
Azs = 0:15:360;
[AzMesh1, ZMesh] = meshgrid(Azs, Sides);
XMesh1 = (R * cosd(AzMesh1));
YMesh1 = (R * sind(AzMesh1));
surf(XMesh1, YMesh1, ZMesh+5);
clc % End
R = 1; N = 10;
Ang1 = linspace(0,360 ,N); Ang2 = linspace(-90,90,N);
[Ang1s, Ang2s] = meshgrid(Ang1,Ang2);
X = ([cosd(Ang2s) .* cosd(Ang1s)])*R;
Y = ([cosd(Ang2s) .* sind(Ang1s)])*R;
Z = ([sind(Ang2s)]+10)*R;
surf(X, Y, Z);


% Eyes
clc
for A = -2:4:2
    R = 1.75; N = 25;
    Ang1 = linspace(0,360 ,N); Ang2 = linspace(-90,90,N);
    [Ang1s, Ang2s] = meshgrid(Ang1,Ang2);
    X = ([cosd(Ang2s) .* cosd(Ang1s)]-A)*R;
    Y = ([cosd(Ang2s) .* sind(Ang1s)]-1.75)*R;
    Z = ([sind(Ang2s)]+.75)*R;
    surf(X, Y, Z);
end


% Smile
clc
Space = linspace(-pi,0,50);
[Thetas, Phis] = meshgrid(Space, Space);
Xarr = (cos(Thetas) .* (7 + cos(Phis)))/1.75;
Yarr = (sin(Phis))-3;
Zarr = ((sin(Thetas) .* (1.85 + cos(Phis)))-1);
surf(Xarr, Yarr, Zarr);


% Ears
clc
for A = -9:18:9
    Space = linspace(0,2*pi,25);
    [Thetas, Phis] = meshgrid(Space, Space);
    Xarr = ((cos(Thetas) .* (3 + cos(Phis)))+A)/1.25;
    Yarr = (sin(Phis));
    Zarr = ((sin(Thetas) .* (3 + cos(Phis)))+4)/1.25;
    surf(Xarr, Yarr, Zarr);
end


% Body
clc
X=linspace(-2,2*pi,50); Y=linspace(0,2*pi,50);
[Y X]=meshgrid(Y,X);
z=(-5.*cos(X).*-2.*sin(Y))-10;
y=(-2.*sin(Y).*-2.*sin(X));
x=(-sqrt(35).*cos(Y));
surf(x,y,z)


% Arms
clc
for A = -2.75:5.5:2.75
    Space = linspace(0,2*pi,50);
    [Thetas, Phis] = meshgrid(Space, Space);
    Xarr = ((cos(Thetas) .* (3 + cos(Phis)))+A)/.75;
    Yarr = (sin(Phis));
    Zarr = ((sin(Thetas) .* (3 + cos(Phis)))-8.5)/.75;
    surf(Xarr, Yarr, Zarr);
end


% Feet
clc
for A = -4:8:4
    X=linspace(-2,2*pi,25); Y=linspace(pi,pi/2,25);
    [Y X]=meshgrid(Y,X);
    x=(-5/2.*cos(X).*-3/2.*sin(Y))-A;
    y=(-3/2.*sin(Y).*-3/2.*sin(X));
    z=(-sqrt(10).*cos(Y))-20;
    surf(x,y,z)
end


text(-8, -4, 9, 'divilabs.com');

axis equal
hold off   


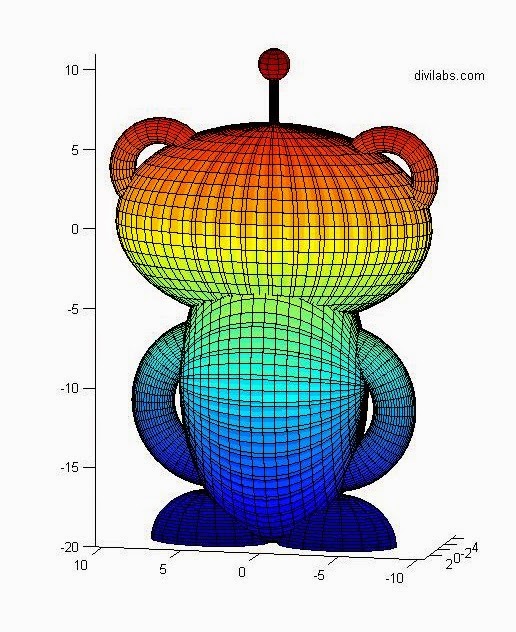
The code looks, very complicated, as it deals with the geometry & the plane orientation. But its working fine. So here is the result of our simulation of the above MATLAB code to plot the reddit alien.
Plotting Reddit dot com Mascot (The Reddit Alien) in MATLAB
Plotting Reddit dot com Mascot (The Reddit Alien) in MATLAB Front View
Plotting Reddit dot com Mascot (The Reddit Alien) in MATLAB
Plotting Reddit dot com Mascot (The Reddit Alien) in MATLAB Back View
So just copy the code above, & let your imagination work to get various changes to it.

Special thanks & congrats to the user @Politics for this brilliant piece of work.


0 comments:

Building a Simple GUI Interface in MATLAB (guide)

Yes, building a simple GUI interface through MATLAB is possible. Just like in Visual Basic or Visual C++, you have a drag & drop feature of buttons, text boxes etc, & then you just need to program them in order to define their functionality. If you want to export it as a standalone executable file, you can even do that. But just like the other languages the application build with MATLAB will require its runtime, to be pre-installed.

So, the GUI interface builder for the MATLAB is known by the name "GUIDE". The fullform of GUIDE is "Graphical user interface design environment".

As the MATLAB official help document states about it:
guide is both a directory and a function.
    Calling guide by itself will open the guide Quick Start Dialog where you can choose to open a previously created GUI or create a new one from templates.
guide(filename) opens the FIG-file for editing where you can build up the GUI & related function.

* Just type in the command window with the command & you will see a pop-up appearing like this.
Guide Quick Start Box in MATLAB
* Select the "Blank GUI" option, which is also being selected by default.
* Then press OK & you will see a GUI workspace being opened up in front of you.

GUI building workspace in MATLAB: guide


      * In left hand side there are many types of button interfaces are there. As according to your requirement pick any button and drop in grid area.

NOTE: There are two interfaces in GUI. One is figure and other one is MATLAB code.


Lets take an example, We just want to build a simple GUI that prints your name by a click of button which is present in the GUI.

STEP 1: Take two push buttons & drag them up in the grid box as shown in the above figure.
STEP 2: Tale one static text box & drag it, over the grid box.
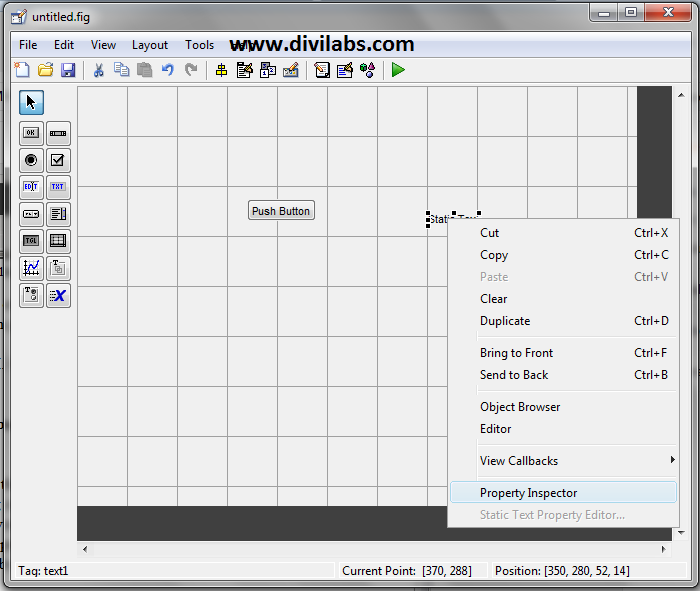
STEP 3: Left click on any button (that you have just got in the grids) and go to property inspector. By the help of this you can change various properties of it like name, color, font size etc.
STEP 4: Clear the section of "static text" box by clearing string in property inspector.


Changing the properties of various objects in MATLAB GUI through Property Inspector
STEP 5: Optional (You can change the size of the button, by dragging the corner points of the button bounding box)
STEP 6: Drag another button (Optional, depends upon your requirement)
Now the resultant GUI will Look like this:
GUI Development in MATLAB
STEP 7: Now the crucial step, go to the "editor" (Right Click on the grid boxes & Select editor) to change in the call back function of the button, which will tell them what to do. It will ask you to save the file with the extension ".fig". Save it & then it will automatically opens the MATLAB editor window, there you have to make changes in the code in order to get the things work.

GUIDE editor option
GUIDE editor option
Here is, what we did in our case (The changes done & added are in BOLD):


function varargout = test1(varargin)
% TEST1 MATLAB code for test1.fig
%      TEST1, by itself, creates a new TEST1 or raises the existing
%      singleton*.
%
%      H = TEST1 returns the handle to a new TEST1 or the handle to
%      the existing singleton*.
%
%      TEST1('CALLBACK',hObject,eventData,handles,...) calls the local
%      function named CALLBACK in TEST1.M with the given input arguments.
%
%      TEST1('Property','Value',...) creates a new TEST1 or raises the
%      existing singleton*.  Starting from the left, property value pairs are
%      applied to the GUI before test1_OpeningFcn gets called.  An
%      unrecognized property name or invalid value makes property application
%      stop.  All inputs are passed to test1_OpeningFcn via varargin.
%
%      *See GUI Options on GUIDE's Tools menu.  Choose "GUI allows only one
%      instance to run (singleton)".
%
% See also: GUIDE, GUIDATA, GUIHANDLES

% Edit the above text to modify the response to help test1

% Last Modified by GUIDE v2.5 05-Apr-2015 01:53:56

% Begin initialization code - DO NOT EDIT
gui_Singleton = 1;
gui_State = struct('gui_Name',       mfilename, ...
                   'gui_Singleton',  gui_Singleton, ...
                   'gui_OpeningFcn', @test1_OpeningFcn, ...
                   'gui_OutputFcn',  @test1_OutputFcn, ...
                   'gui_LayoutFcn',  [] , ...
                   'gui_Callback',   []);
if nargin && ischar(varargin{1})
    gui_State.gui_Callback = str2func(varargin{1});
end

if nargout
    [varargout{1:nargout}] = gui_mainfcn(gui_State, varargin{:});
else
    gui_mainfcn(gui_State, varargin{:});
end
% End initialization code - DO NOT EDIT


% --- Executes just before test1 is made visible.
function test1_OpeningFcn(hObject, eventdata, handles, varargin)
% This function has no output args, see OutputFcn.
% hObject    handle to figure
% eventdata  reserved - to be defined in a future version of MATLAB
% handles    structure with handles and user data (see GUIDATA)
% varargin   command line arguments to test1 (see VARARGIN)

% Choose default command line output for test1
handles.output = hObject;

% Update handles structure
guidata(hObject, handles);

% UIWAIT makes test1 wait for user response (see UIRESUME)
% uiwait(handles.figure1);


% --- Outputs from this function are returned to the command line.
function varargout = test1_OutputFcn(hObject, eventdata, handles)
% varargout  cell array for returning output args (see VARARGOUT);
% hObject    handle to figure
% eventdata  reserved - to be defined in a future version of MATLAB
% handles    structure with handles and user data (see GUIDATA)

% Get default command line output from handles structure
varargout{1} = handles.output;


% --- Executes on button press in pushbutton1.
function pushbutton1_Callback(hObject, eventdata, handles)
% hObject    handle to pushbutton1 (see GCBO)
% eventdata  reserved - to be defined in a future version of MATLAB
% handles    structure with handles and user data (see GUIDATA)
set(handles.text1,'string','vijay sharma');

% --- Executes on button press in pushbutton2.
function pushbutton2_Callback(hObject, eventdata, handles)
% hObject    handle to pushbutton2 (see GCBO)
% eventdata  reserved - to be defined in a future version of MATLAB
% handles    structure with handles and user data (see GUIDATA)
set(handles.text1,'string','vibhutesh');
 

Step 8: Now Run it, you can see a play button in the MATLAB's GUI building Interface, just click once & it will execute your GUI.
GUI Designed in MATLAB with 2 Buttons & a Static Text Box to Display the Output


Press push button. And see the output!

NOTE: In MATLAB GUI all variables to be displayed should be in string Data Type. So if you taking and number so change it into string.

0 comments: