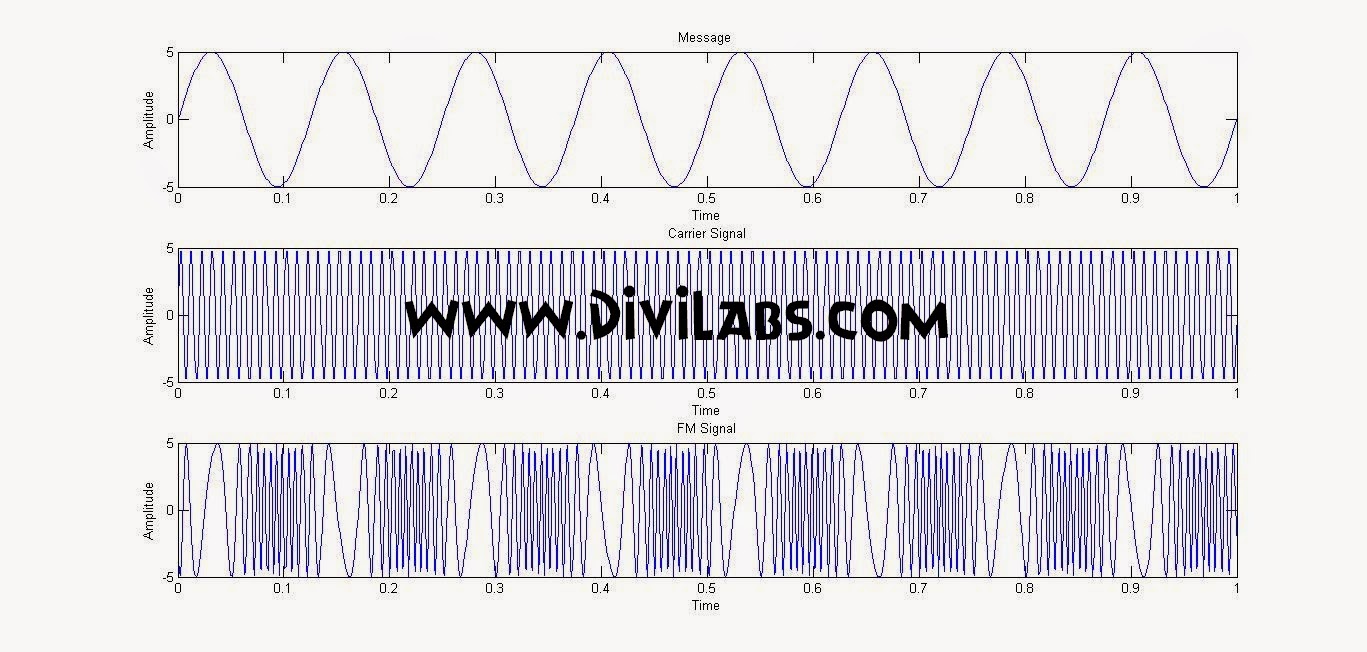
Frequency Modulation (FM) Simulation / Generation Using MATLAB Code
Frequency Modulation using MATLAB
Frequency modulation (FM) is the encoding of information in a carrier wave by varying the instantaneous frequency of the wave. The amount of frequency variation is proportional to the Modulation index.
A major advantage of FM as compared with AM, is improved Signal-to-noise ratio
(SNR). The improvement depends on modulation level
and deviation. For typical voice communications channels, improvements
are typically 5-15 dB.
The following MATLAB code for generating/simulating the Frequency Modulation requires 5 inputs, amplitude of both message & signal, frequency of both message & signal & the modulation index.
MATLAB CODE For FM (Frequency Modulation)
clc
clear all
close all
t = 0:0.001:1; %upto 1000 samples
vm = input('Enter Amplitude (Message) = ');
vc = input('Enter Amplitude (Carrier) = ');
fM = input('Enter Message frequency = ');
fc = input('Enter Carrier frequency = ');
m = input('Enter Modulation Index = ');
msg = vm*sin(2*pi*fM*t);
subplot(3,1,1); %plotting message signal
plot(t,msg);
xlabel('Time');
ylabel('Amplitude');
title('Message ');
carrier = vc*sin(2*pi*fc*t);
subplot(3,1,2); %plotting carrier signal
plot(t,carrier);
xlabel('Time');
ylabel('Amplitude');
title('Carrier Signal');
y = vc*sin(2*pi*fc*t+m.*cos(2*pi*fM*t));
subplot(3,1,3);%plotting FM (Frequency Modulated) signal
plot(t,y);
xlabel('Time');
ylabel('Amplitude');
title('FM Signal');
Sample MATLAB Input:
Enter Amplitude (Message) = 5
Enter Amplitude (Carrier) = 5
Enter Message frequency = 8
Enter Carrier frequency = 100
Enter Modulation Index = 10
Enter Amplitude (Carrier) = 5
Enter Message frequency = 8
Enter Carrier frequency = 100
Enter Modulation Index = 10
MATLAB's Output For The Above Input:
 |
| Frequency Modilation (FM) Simulation / Generation Using MATLAB Code |
Visit More On Digital iVision Labs:
#FSK Simulation Code Using MATLAB
#Phase Shift Keying (PSK) Modulation MATLAB Simulation, With MATLAB Code
#Amplitude Shift Keying (ASK) Modulation MATLAB Simulation, With MATLAB Code
#Matlab Christmas Tree Plot- Christmas celebration through matlab way - Merry Christmas!#FSK Simulation Code Using MATLAB
#Phase Shift Keying (PSK) Modulation MATLAB Simulation, With MATLAB Code
#Amplitude Shift Keying (ASK) Modulation MATLAB Simulation, With MATLAB Code

5 comments: