Amplitude Shift Keying (ASK) Modulation MATLAB Simulation, With MATLAB Code
So what is ASK or Amplitude Shift Keying?
Amplitude-shift keying (ASK) is a form of amplitude modulation (AM) that projects a digital data as variations in the amplitude of a carrier wave (Which is particularly a High Frequency Sinusoidal wave).
In an ASK system ,binary symbol 1 is represented by transmitting
carrier wave of fixed amplitude and fixed frequency for the bit duration
T second, the binary symbol 0 will be represented by not transmitting any wave for another bit duration T seconds.
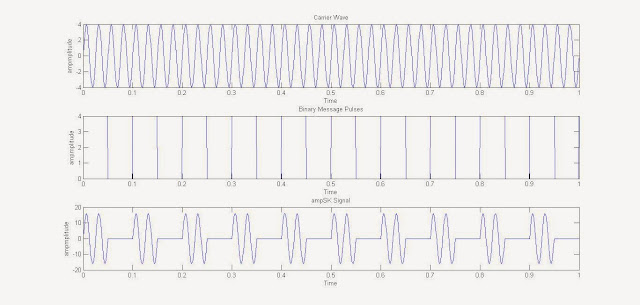
In the example MATLAB Simulation of Amplitude Shift Keying (ASK), the user is asked about the frequency of the carrier wave, binary message periodic pulse & the amplitude of the waves (considering both square message wave & carrier wave have equal amplitude).
The MATLAB code lets the user to plot 3 graphs, namely of The Carrier Wave (Sinusoid), The Binary Message Pulse & The Amplitude Shift Keyed Wave.
MATLAB Code FOR ASK (Amplitude Shift Keying) :
clc %for clearing the command window
close all %for closing all the window except command window
clear all %for deleting all the variables from the memory
fc=input('Enter the freq of Sine Wave carrier:');
fp=input('Enter the freq of Periodic Binary pulse (Message):');
amp=input('Enter the amplitude (For Carrier & Binary Pulse Message):');
t=0:0.001:1; % For setting the sampling interval
c=amp.*sin(2*pi*fc*t);% For Generating Carrier Sine wave
subplot(3,1,1) %For Plotting The Carrier wave
plot(t,c)
xlabel('Time')
ylabel('Amplitude')
title('Carrier Wave')
m=amp/2.*square(2*pi*fp*t)+(amp/2);%For Generating Square wave message
subplot(3,1,2) %For Plotting The Square Binary Pulse (Message)
plot(t,m)
xlabel('Time')
ylabel('Amplitude')
title('Binary Message Pulses')
w=c.*m; % The Shift Keyed Wave
subplot(3,1,3) %For Plotting The Amplitude Shift Keyed Wave
plot(t,w)
xlabel('Time')
ylabel('Amplitude')
title('Amplitide Shift Keyed Signal')
NOTE: Use Semicolon ';' in order to suppress the output from coming to the MATLAB's Command Window, whenever declaring a periodic pulse, as it can display a vary large matrix in the output, so you can miss what you want.
INPUTS GIVEN TO GENERATE ASK MODULATED WAVE:
Enter the freq of Sine Wave carrier:100
Enter the freq of Periodic Binary pulse (Message):10
Enter the amplitude (For Both Carrier & Binary Pulse Message):4
Enter the freq of Periodic Binary pulse (Message):10
Enter the amplitude (For Both Carrier & Binary Pulse Message):4
RESULT:
 |
| Resultant Graph Of ASK Modulation (Amplitude Shift Keying) In MATLAB |

0 comments: