Plotting PSD (Power Spectral Density) of a given Signal Using MATLAB
The power spectral density, or PSD is a measure of the power contained in the frequencies of the signal. We need to comply with the Nyquist criterion if we want a properly frequency PSD of the signal, since you will see a power spillage over other frequencies due to the phenomenon of aliasing. In the older version of MATLAB "septrum " command was
used for calculating power spectrum density. But for the later version, it has become obsolete
and may be removed in further versions, but there are other functions that you can use to judge the spectrum. Such as "pwelch".
The function "pwelch" stands for Power Spectral Density estimate via Welch's method.
Here, in this plotting example we are going to use 3 different frequencies of sine & cosine waves. Along will the addition of AWGN with the 3 summed up signal. The signal is sampled by taking care the Nyquist criterion.
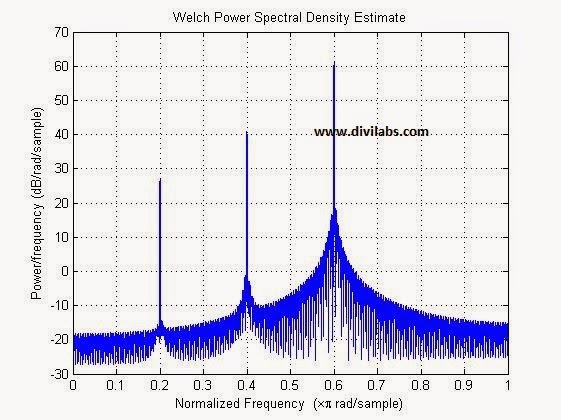
The 3 frequencies in use are, 100 Hz, 200 Hz & 300 Hz. The sampling rate that we have kept is 1000Hz. In the plot you will see a angular frequency plot normalized to a value 0 to 1.
MATLAB implementation / code to plot the PSD of a given signal, with AWGN.
fs=1000; % the sampling frequency
dt = 1/fs;
t = dt:dt:10000*dt; % to gather signal data till 10000th sample
cosine = 2*cos(2*pi*100*t); % a cosine wave with 100Hz frequency
cosine1 = 10*cos(2*pi*200*t); % a cosine wave with 200Hz frequency
sine = 100*sin(2*pi*300*t); % a sine wave with 300Hz frequency
y = cosine + cosine1 + sine; % adding the above 3 signal
y=awgn(y,0); % adding AWGN to the resultant summed up signal
pwelch(y,[], [], [], 'psd') % plotting the PSD using welch method
pwelch(y,[], [], [], 'psd') % plotting the PSD using welch method
Result of above MATLAB code to plot the PSD of the signal with AWGN is:
 |
| MATLAB implementation / code to plot the PSD of a given signal, with AWGN |
MATLAB implementation / code to plot the PSD of a given signal, without AWGN.
fs=1000; % the sampling frequency
dt = 1/fs;
t = dt:dt:10000*dt; % to gather signal data till 10000th sample
cosine = 2*cos(2*pi*100*t); % a cosine wave with 100Hz frequency
cosine1 = 10*cos(2*pi*200*t); % a cosine wave with 200Hz frequency
sine = 100*sin(2*pi*300*t); % a sine wave with 300Hz frequency
y = cosine + cosine1 + sine; % adding the above 3 signal
dt = 1/fs;
t = dt:dt:10000*dt; % to gather signal data till 10000th sample
cosine = 2*cos(2*pi*100*t); % a cosine wave with 100Hz frequency
cosine1 = 10*cos(2*pi*200*t); % a cosine wave with 200Hz frequency
sine = 100*sin(2*pi*300*t); % a sine wave with 300Hz frequency
y = cosine + cosine1 + sine; % adding the above 3 signal
pwelch(y,[], [], [], 'psd') % plotting the PSD using welch method
Result of above MATLAB code to plot the PSD of the signal without AWGN is:
 |
| MATLAB implementation / code to plot the PSD of a given signal, without AWGN |
NOTE: You can see the 3 peaks in both the cases, & they have different amplitude levels in the PSD, that is due to the fact that while creating the samples of the signal I have multiplied them with different amplitude level, & the PSD can be estimated simply by using a crude formulae, square(|a|), here 'a' is the amplitude level of the signal.

0 comments: