Defining FSK (Frequency Shift Keying):
Frequency-shift keying (FSK) is a frequency modulation scheme in which digital information is transmitted through carrier frequency. The simplest FSK is binary FSK (BFSK). BFSK uses a pair of discrete frequencies to transmit binary (0s and 1s) information. If the number of symbols to transmit is more than 2, so we will just have to use as many carriers as the number of symbols.
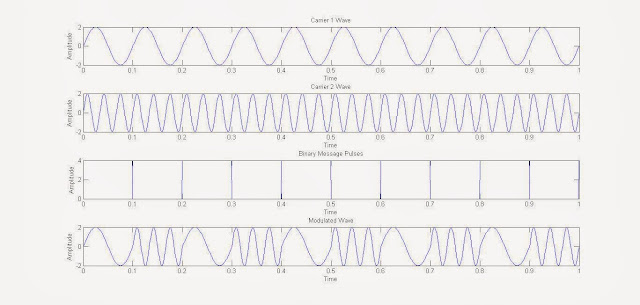
The given example of MATLAB Simulation of Frequency Shift Keying (FSK), the
user is asked about the frequency of the two carrier wavea, Message
periodic pulse & the Amplitude of the waves (considering for square
message wave & both carrier wave have equal amplitude). The frequency of the
carrier wave will change from f1 to f2 or vice versa whenever a zero is changed to 1
or vice-verso. The frequency will not change if in 2 successive time period
there is no change in message bit value.
The MATLAB below code lets the user to plot 4 graphs, namely 2 graph plot of The Carrier
Waves (Sinusoid), The Binary Message Pulse & The Modulated Wave.
MATLAB Code FOR FSK (Frequency Shift Keying) BFSK in this case:
clc %for clearing the command window
close all %for closing all the window except command window
clear all %for deleting all the variables from the memory
fc1=input('Enter the freq of 1st Sine Wave carrier:');
fc2=input('Enter the freq of 2nd Sine Wave carrier:');
fp=input('Enter the freq of Periodic Binary pulse (Message):');
amp=input('Enter the amplitude (For Both Carrier & Binary Pulse Message):');
amp=amp/2;
t=0:0.001:1; % For setting the sampling interval
c1=amp.*sin(2*pi*fc1*t);% For Generating 1st Carrier Sine wave
c2=amp.*sin(2*pi*fc2*t);% For Generating 2nd Carrier Sine wave
subplot(4,1,1); %For Plotting The Carrier wave
plot(t,c1)
xlabel('Time')
ylabel('Amplitude')
title('Carrier 1 Wave')
subplot(4,1,2) %For Plotting The Carrier wave
plot(t,c2)
xlabel('Time')
ylabel('Amplitude')
title('Carrier 2 Wave')
m=amp.*square(2*pi*fp*t)+amp;%For Generating Square wave message
subplot(4,1,3) %For Plotting The Square Binary Pulse (Message)
plot(t,m)
xlabel('Time')
ylabel('Amplitude')
title('Binary Message Pulses')
for i=0:1000 %here we are generating the modulated wave
if m(i+1)==0
mm(i+1)=c2(i+1);
else
mm(i+1)=c1(i+1);
end
end
subplot(4,1,4) %For Plotting The Modulated wave
plot(t,mm)
xlabel('Time')
ylabel('Amplitude')
title('Modulated Wave')
The following INPUTS GIVEN TO GENERATE FSK MODULATED WAVE:
Enter the freq of 1st Sine Wave carrier:10
Enter the freq of 2nd Sine Wave carrier:30
Enter the freq of Periodic Binary pulse (Message):5
Enter the amplitude (For Both Carrier & Binary Pulse Message):4
Result:
 |
| Frequency Shift Keying (FSK) Digital Modulation MATLAB Simulation |
Read MORE:
An active & prominent author at Digital iVision Labs! Specializing in MATLAB, C++, Arduino, OpenCV, NI Labview, Web Designing & other Electronics stuffs! Just started M.Tech. From IIIT Delhi, looking for excellent PhD Opportunities with prominent researchers. Drop a mail: vibhutesh[at]gmail.com or Follow him at....


0 comments: