Rayleigh distribution PDF & CDF plot in MATLAB using & without using Inbuilt Functions
The Rayleigh distribution, is named after Lord Rayleigh.
It is the distribution of the magnitude of a two-dimensional random vector
whose coordinates are independent, identically distributed, zero mean normal variables.
The Rayleigh Distribution
Suppose that Z1 and Z2 are normally distributed independent random variables. The magnitude R=Z21+Z22−−−−−−−√ has the Rayleigh distribution.
The Rayleigh PDF
It is defined by the following expression:
The Rayleigh CDF

Here "σ" may be considered as rms value of the received voltage signal, if seen through a communication engineer point of view.
Rayleigh fading
Rayleigh fading model assume that the magnitude of a signal that has passed through such a communication channel will fade, according to a Rayleigh distribution — the radial component of the sum of two uncorrelated Gaussian random variables.
It is viewed as a justified model for tropospheric and ionospheric signal propagation as well as the effect of heavily cluttered urban environments on wireless communication channel. Rayleigh fading is most applicable when there is no dominant propagation along a line of sight between the 2 communication ends. But if there is, Rician fading will be more applicable.
MATLAB Code for Plotting Rayleigh Distribution PDF & CDF without using the inbuilt function of Rayleigh PDF & CDF:
%also the mean, variance & median have been calculated in the code
clc;
close all;
clear all;
sig=1; %RMS value of received voltage signal
r = 0:0.1:10; %the range of value of 'r'
pdf=(r/sig.^2) .* exp(-r.^2/2*(sig.^2)); % the Rayleigh PDF
figure;
plot(r,pdf,'b') %Plotting the Rayleigh PDF
title('Rayleigh PDF Plot');
xlabel('r');
ylabel('p(r)');
cdf=1-exp(-r.^2/(2*1)); % the Rayleigh CDF
figure;
plot(r,cdf,'b') %Plotting the Rayleigh PDF
title('Rayleigh CDF Plot');
xlabel('r');
ylabel('P(r)');
mean=1.2533*sig; %mean of the Rayleigh distribution
varr=0.4292*(sig^2); %variance of the Rayleigh distribution
median=1.177*sig; %median of the Rayleigh PDF
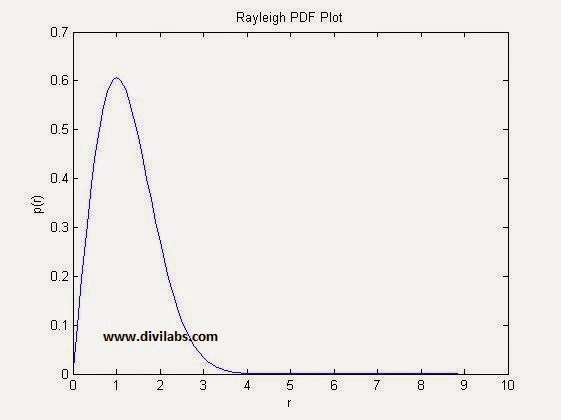
Result of The above Code:
 |
| Rayleigh distribution CDF MATLAB Plot With σ=1 |
 |
| Rayleigh distribution PDF MATLAB Plot With σ=1 |
The same plot can be obtained by using the MATLAB's inbuilt Rayleigh distribution PDF & CDF function, raylpdf & raylcdf. Just replace the function definition part with the proper formatted raylpdf & raylcdf.
The code after the necessary modification (Now we are using MATLAB inbuilt functions of Rayleigh Distribution PDF & CDF) will look like: [The modification done is denoted by ****]
clc;
close all;
clear all;
sig=1; %RMS value of received voltage signal
r = 0:0.1:10; %the range of value of 'r'
pdf=raylpdf(r,sig); % the Rayleigh PDF ****
figure;
plot(r,pdf,'b') %Plotting the Rayleigh PDF
title('Rayleigh PDF Plot');
xlabel('r');
ylabel('p(r)');
cdf=raylcdf(r,sig); % the Rayleigh CDF
figure;
plot(r,cdf,'b') %Plotting the Rayleigh PDF ****
title('Rayleigh CDF Plot');
xlabel('r');
ylabel('P(r)');
mean=1.2533*sig; %mean of the Rayleigh distribution
varr=0.4292*(sig^2); %variance of the Rayleigh distribution
median=1.177*sig; %median of the Rayleigh PDF
The Result of Above code for plotting the PDF & CDF of Rayleigh Distribution Using MATLAB inbuilt function is:
 |
| Rayleigh distribution CDF MATLAB Plot With σ=1 |
 |
| Rayleigh distribution PDF MATLAB Plot With σ=1 |
Just have a try with different range of 'r' or a different value of sigma.

0 comments: